Tuesday, August 27, 2019

Python - Detect outliers using moving average

In this piece of code, you can change window_size to determine how you want to calculate the average. e.g. using 6 months of adjacent data. You can change the sigma_value to determine the abnormal points you want to capture. e.g. if you assume 99.7% of data are normally distributed, then set sigma_value= 3. You can change the start and end values to determined how many months of production you want to see.

from scrapers import config_sql
from itertools import count
import matplotlib.pyplot as plt
import numpy as np
import pandas as pd
import collections


def moving_average(data, window_size):
    weight = np.ones(int(window_size)) / float(window_size)
    return np.convolve(data, weight, 'same')  # ways to handle edges. the mode are 'same', 'full', 'valid'


def detect_anomalies(y, window_size, sigma):
    # slide a window along the input and compute the mean of the window's contents
    avg = moving_average(y, window_size).tolist()
    residual = y - avg
    # Calculate the variation in the distribution of the residual
    std = np.std(residual)
    return {'standard_deviation': round(std, 3),
            'anomalies_dict': collections.OrderedDict([(index, y_i) for index, y_i, avg_i in zip(count(), y, avg) if (y_i > avg_i + (sigma * std)) | (y_i < avg_i - (sigma * std))])}  # distance from the mean


# This function is responsible for displaying how the function performs on the given dataset.
def plot_results(x, y, window_size, sigma_value, text_xlabel, text_ylabel, start, end):
    plt.figure(figsize=(15, 8))
    plt.plot(x, y, "k.")
    y_av = moving_average(y, window_size)
    try:
        plt.plot(x, y_av, color='blue')
        plt.plot(x, y, color='green')
        plt.xlim(start, end)  # this can let you change the plotted date frame
        plt.xlabel(text_xlabel)
        plt.ylabel(text_ylabel)

        events = detect_anomalies(y, window_size=window_size, sigma=sigma_value)
        x_anomaly = np.fromiter(events['anomalies_dict'].keys(), dtype=int, count=len(events['anomalies_dict']))
        y_anomaly = np.fromiter(events['anomalies_dict'].values(), dtype=float, count=len(events['anomalies_dict']))
        print(collections.OrderedDict([(x, y) for index, x, y in zip(count(), x_anomaly, y_anomaly)]))
        ax = plt.plot(x_anomaly, y_anomaly, "r.", markersize=12)

        # add grid and lines and enable the plot
        plt.grid(True)
        plt.show()

    except Exception as e:
        pass


# Main
if __name__ == '__main__':
    conn = config_sql.sql_credentials('XXXXX', 'XXXX')
    cursor = conn.cursor()

    query = "XX where bridge_Id in('8368051','8502207','8369707','8520772','8420250','12776634')"

    df = pd.read_sql(query, conn)
    cols = ['bridge_id', 'product_name', 'metric_date', 'prod_value']
    oil_prod = df.loc[df['product_name'] == 'Gas']
    prod_as_frame = pd.DataFrame(oil_prod, columns=['bridge_id', 'product_name', 'metric_date', 'prod_value'])

    # get unique list of bridge
    rows = cursor.execute(query)
    unique_bridge = set(list(zip(*list(rows.fetchall())))[0])

    for bridge_id in unique_bridge:
        print('bridge_Id: ' + str(bridge_id))
        prod = prod_as_frame[prod_as_frame.bridge_id == bridge_id].reindex()
        prod['mop'] = range(1, len(prod) + 1)

        x = prod['mop']
        Y = prod['prod_value']
        max_x = max(x) # this can let you change the plotted date frame
        print(prod)

        # plot the results
        plot_results(x, y=Y, window_size=6, sigma_value=3, text_xlabel="MOP", text_ylabel="production", start=1, end=max_x)


Background knowlodge:
np.std
{\displaystyle s={\sqrt {{\frac {1}{N-1}}\sum _{i=1}^{N}(x_{i}-{\bar {x}})^{2}}},}
To quantify the amount of variation or dispersion of dataset.
Low std means data points tend to be close to the mean; high std means the data points are spread out over a wide range of values.
np.Convolve
{\displaystyle (f*g)(t)\triangleq \ \int _{-\infty }^{\infty }f(\tau )g(t-\tau )\,d\tau .}
Is defined as the integral of the product of two functions after one is reversed and shifted.
It is an operation on two functions to produce a third function that express how the shape of one is modified by the other.
Rules of normally distributed data (68-95-99.7 rule)
{\displaystyle {\begin{aligned}\Pr(\mu -1\sigma \leq X\leq \mu +1\sigma )&\approx 0.6827\\\Pr(\mu -2\sigma \leq X\leq \mu +2\sigma )&\approx 0.9545\\\Pr(\mu -3\sigma \leq X\leq \mu +3\sigma )&\approx 0.9973\end{aligned}}}Image result for empirical rule of normally distributed data
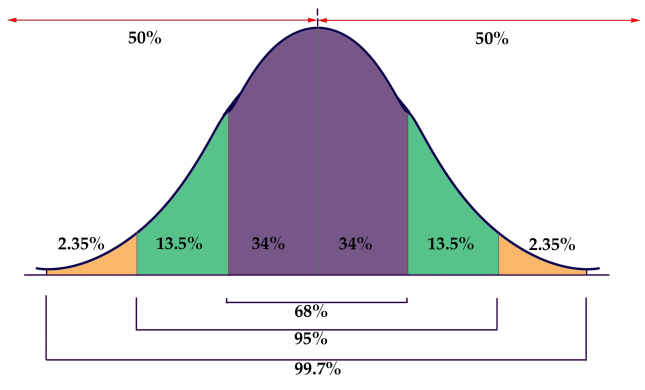
If a data distribution is approximately normal, then about 68% of the data value are within 1 std of the mean 

Thursday, August 1, 2019

SQL - Use of PARSENAME() function

Sometimes when we have pivoted value in excel or csv with title as 'Column 1','Column 2',...'Column n'. But in the meantime, those columns means the dates like 1980-01-01, 1980-02-01. After unpivot the data into sql , the data will be like this:
API               date_string Product
053-29070 Column 112 Oil
053-29070 Column 113 Oil
053-29070 Column 118 Oil
053-29070 Column 172 Oil
053-29070 Column 173 Oil
053-29070 Column 177 Oil
053-29070 Column 178 Oil
053-29070 Column 19 Oil
Then how do we know the corresponding year and month?

So here is the trick. Function PARSENAME() can get the specific part of a string delimited by a delimiter. so
for SELECT PARSENAME(12.3,1), you will get 3,
for SELECT PARSENAME(13%12,1), you will get 1

so by using this function together with remainder function, we can get the month of the data.
by using some tricks with number/12, we can get the year of the data.

date_string date_int month_indicator year_indicator date_int_plus
Column 1 1 1 0 2
Column 2 2 2 0 3
Column 3 3 3 0 4
Column 4 4 4 0 5
Column 5 5 5 0 6
Column 6 6 6 0 7
Column 7 7 7 0 8
Column 8 8 8 0 9
Column 9 9 9 0 10
Column 10 10 10 0 11
Column 11 11 11 0 12
Column 12 12 0 1 13
Column 13 13 1 1 14
Column 14 14 2 1 15
Column 15 15 3 1 16
Column 16 16 4 1 17
Column 17 17 5 1 18
Column 18 18 6 1 19
Column 19 19 7 1 20
Column 20 20 8 1 21
Column 21 21 9 1 22
Column 22 22 10 1 23
Column 23 23 11 1 24

--------------------------update production_month---------------------------------------
so we can   set  production_month = 
     case      when PARSENAME(cast(replace(date_string,'Column ','') as int)%12,1) = 1 then 1
                  when PARSENAME(cast(replace(date_string,'Column ','') as int)%12,1) = 2 then 2
  when PARSENAME(cast(replace(date_string,'Column ','') as int)%12,1) = 3 then 3
  when PARSENAME(cast(replace(date_string,'Column ','') as int)%12,1) = 4 then 4
  when PARSENAME(cast(replace(date_string,'Column ','') as int)%12,1) = 5 then 5
  when PARSENAME(cast(replace(date_string,'Column ','') as int)%12,1) = 6 then 6
  when PARSENAME(cast(replace(date_string,'Column ','') as int)%12,1) = 7 then 7
  when PARSENAME(cast(replace(date_string,'Column ','') as int)%12,1) = 8 then 8
  when PARSENAME(cast(replace(date_string,'Column ','') as int)%12,1) = 9 then 9
  when PARSENAME(cast(replace(date_string,'Column ','') as int)%12,1) = 10 then 10
  when PARSENAME(cast(replace(date_string,'Column ','') as int)%12,1) = 11 then 11
  when PARSENAME(cast(replace(date_string,'Column ','') as int)%12,1) = 0 then 12
  else null 
  end
--------------------------update production_year---------------------------------------
IF OBJECT_ID('tempdb..#tbl_prod') IS NOT NULL DROP TABLE #tbl_prod
select distinct cast(PARSENAME(cast(replace(date_string,'Column ','') as int)/12,1) as int) as year_indicator, cast(replace(date_string,'Column ','') as int) +1 as date_int_plus
into #tbl_prod
from XXXX with (nolock)

DECLARE @counter int = 0; 
WHILE @counter <= (select max(cast(replace(date_string,'Column ','') as int)) from XXXX)
BEGIN
update a
set production_year = 1980 + @counter
from XXXX a ,#tbl_prod b
where b.year_indicator = @counter and cast(replace(a.date_string,'Column ','') as int) =               
                  b.date_int_plus and a.api <> '' and a.volume <> 0 and a.volume is not null ;
SET @counter = @counter + 1;
END

--only column 1 is not assigned a year
update XXXX
set production_year = 1980
where date_string = 'Column 1' and api <> '' and volume is not null and volume <> 0;

Or just the easiest way. Use SELECT DATEADD(MONTH,+1,getdate()) to get the date.

Tuesday, June 18, 2019

SQL - Search all tables which contain specific columns in one database

USE your_DB_Name;
SELECT      c.name  AS 'ColumnName' ,t.name AS 'TableName'
FROM        sys.columns c  JOIN sys.tables  t ON c.object_id = t.object_id
WHERE       (t.name like 'LA%' or t.name like '%luw%' or t.name like 'Louisana%' )
        and c.name in ('API','API_NUM','API num','Well_Serial_Num','Well_Serial_No',
'WELL_SERIA','Well Serial Number','WSN','Serial_no','Well_Serial','well Serial Num')
ORDER BY    TableName  ,ColumnName;

Thursday, June 13, 2019

Python - Web Scraping - request needs to post json parameters

There are some websites that taking json data as parameters in the url.
e.g.
https://rrcsearch3.neubus.com/esd3-rrc/index.php_module_=esd&_action_=keysearch&profile=28.

This kind of website does not need to do several get or post to get the final result even though there are lots of websites pop up before the final one, like:

What you really need is just the final page + the urlencoded json parameters:

params = urlencode({
    'json': json.dumps({"Neusearch": {"profile": "28", "api_key": "publicuser",  
           "api_sig": "68461babf138014f252e64732ef3b1a0",               
           "Searchitems": {"item": [{"key": "operator_number", "value": '243195'}]},      
           "page": 0, "pageSize": 50, "strict": "true", "saveSearch": "true"}})

})

scraper.do.http_post(
    url=context['address'] + '&' + params,   
    send_to=detail,    
    data=params,    
    context=context
)

But, remember the header should include the referer since you are not doing get and post from the very first page:

headers = {
    "User-Agent": "Mozilla/5.0 (Macintosh; Intel Mac OS X 10_14_5).....,
    'Content-Type': 'application/x-www-form-urlencoded',    
    'Referer': 'https://XXXXXXXX/index.php?........}

Difference between json.dumps() and json.dump()
dumps是将dict转化成str格式,loads是将str转化成dict格式。
dump和load也是类似的功能,只是与文件操作结合起来了。

Thursday, May 9, 2019

SQL - Propper case function as in Excel

CREATE FUNCTION  dbo.fn_ProperCase
(
@str AS nvarchar(100)
)
RETURNS nvarchar(255)
AS
BEGIN
DECLARE
@ret_str AS varchar(100),
@pos AS int,
@len AS int

SELECT
@ret_str = N' ' + LOWER(@str),
@pos = 1,
@len = LEN(@str) + 1

WHILE @pos > 0 AND @pos < @len
BEGIN
SET @ret_str = STUFF(@ret_str,
@pos + 1,
1,
UPPER(SUBSTRING(@ret_str,@pos + 1, 1)))
SET @pos = CHARINDEX(N' ', @ret_str, @pos + 1)
END

RETURN RIGHT(@ret_str, @len - 1)

END

Tuesday, April 30, 2019

Power Shell - Search text in files from one directory

If you want to search a specific string within lots of files. Below is what you can do. I use this to search string in SSIS packages:

1. open text file and save as ".ps1";

2. write the following code:

$Path = "your file directory"
$Text = "text you want to search"
$PathArray = @()

# This code snippet gets all the files in $Path that end in ".dtsx".
Get-ChildItem $Path -Filter "*.dtsx" |
Where-Object { $_.Attributes -ne "Directory"} |
ForEach-Object {
If (Get-Content $_.FullName | Select-String -Pattern $Text) {
$PathArray += $_.FullName
}
}
Write-Host "Contents of ArrayPath:"
$PathArray | ForEach-Object {$_}

3. Run the code through powershell_ise.exe which is the GUI for you to look at the data.
(usually it is under c:\Windows\System32\WindowsPowerShell\v1.0\)

Monday, April 29, 2019

SQL - to search for specific string used in views or sp

Sometimes after you defined something in your table, e.g. to assigned "Unknown" to a value which is not found from the source. Later, you decide to change "Unknown" to "Undetermined". Then you need to change all places that use that values. Then the following scripts may speed up your modification:


SELECT [Scehma]=schema_name(o.schema_id), o.Name, o.type
FROM sys.sql_modules m
INNER JOIN sys.objects o
ON o.object_id = m.object_id
WHERE m.definition like '%Unknown%' or  m.definition like '%Unassigned%'